Creating 1D Plots
The PlotBuilder class in ResultDataAccess provides an interface for constructing 1D plots by assembling datasets and associated curve configurations. Data values are stored directly in the result collection when executing the addCurve method, while metadata entities are instantiated during the final plot build phase. Once all intended curves are added, invoking the buildPlot method will create all necessary metadata and curve entities, and the plot entit itself. Optionally, a new model state may be created.
1. Initialize the Plot Builder
ResultCollectionExtender extender(Application::instance());
PlotBuilder plotBuilder(extender);
2. Create a Dataset Description
Each DatasetDescription contains a single quantity and one or more parameters.
2.1 Add a Parameter
For each parameter, a MetadataParameter instance is constructed.
DatasetDescription dataset;
MetadataParameter parameter;
for (double& value : xValues)
{
    parameter.values.push_back(ot::Variable(value));
}
parameter.unit = xUnit;
parameter.parameterName = xLabel;
parameter.typeName = ot::TypeNames::getDoubleTypeName();

bool isConst = false; // Set to true if parameter is constant for the entire dataset
std::shared_ptr<ParameterDescription> parameterDescr(new ParameterDescription(parameter, isConst));
dataset.addParameterDescription(parameterDescr);
A constant parameter example: the edge length of a cube in simulations that vary only the frequency. All parameter can be shared across multiple dataset descriptions since it is stored as shared reference.
2.2 Add a Quantity
A QuantityDescription defines the dataset’s quantity values. In this case, we define a real-valued scalar quantity using QuantityDescriptionCurve.
std::unique_ptr<QuantityDescriptionCurve> quantity(new QuantityDescriptionCurve());
for (const double& value : yValues)
{
    quantity->addDatapoint(ot::Variable(value));
}
quantity->setName(yLabel);
const std::string secondLevelLabel = "";
quantity->addValueDescription(secondLevelLabel, ot::TypeNames::getDoubleTypeName(), yUnit);
dataset.setQuantityDescription(quantity.release());
Quantity naming supports two levels. The top-level name (e.g., “Voltage”) is required. Additional descriptors (e.g., “DC”, “AC”) allow grouping under the same base name. In this example the quantity does not hold a tuple, so that only a single description is added. Ownership of the quantity data is transferred to the dataset.
1. Create a Curve
Curve configuration is encapsulated in Plot1DCurveCfg. A minimal configuration is shown below:
ot::Plot1DCurveCfg curveCfg;
curveCfg.setTitle(curveName);
curveCfg.setXAxisTitle(xLabel);
curveCfg.setXAxisUnit(xUnit);
curveCfg.setYAxisTitle(yLabel);
curveCfg.setYAxisUnit(yUnit);

const std::string seriesName = curveName;
plotBuilder.addCurve(std::move(dataset), curveCfg, seriesName);
The final curve entity will be stored under the path:
Solver/<Solver_Name>/Results/1D/<plotName>/<curveName>
Only the final component (curveName) is required by the builder. The series metadata entity, stored under Dataset/<seriesName>, links data points to the collection. Again, the builder only requires the last component.
Multiple datasets can be grouped under a single curve entity. For instance, storing S11, S22, and S33 parameters would require three datasets (each with a single quantity) but could be added either as separate curves or grouped under a single curve entity.
3.1 Set Curve Color
A conviniend method to choose a colour is by iterating through the colour schema depending rainbow.
ot::PainterRainbowIterator rainbowPainterIt;
auto stylePainter = rainbowPainterIt.getNextPainter();
curveCfg.setLinePen(stylePainter.release());
4. Create a Plot
After adding at least one curve, the final plot can be created.
ot::Plot1DCfg plotCfg;
plotCfg.setEntityName(fullPlotName);
const bool storeModelState = false;
plotBuilder.buildPlot(plotCfg, storeModelState);
The default configuration generates a Cartesian plot with real number values. The full entity path must be provided, e.g.:
Solver/<Solver_Name>/Results/1D/<plotName>
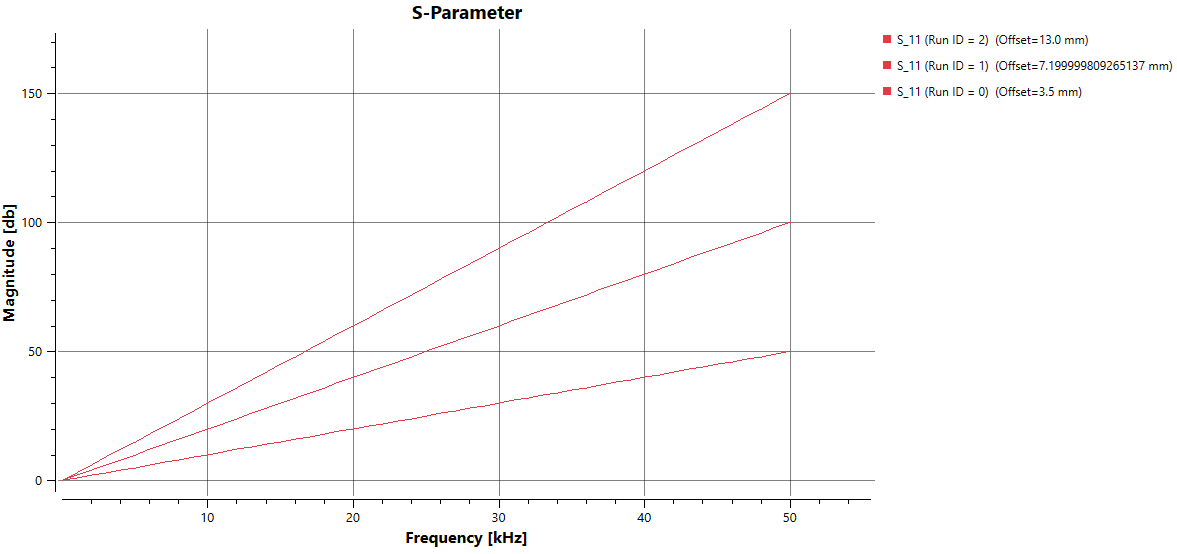
5. Example
const std::string collName = Application::instance()->getCollectionName();

ResultCollectionExtender extender(collName, *Application::instance()->modelComponent(), &Application::instance()->getClassFactory(), OT_INFO_SERVICE_TYPE_ImportParameterizedDataService);
PlotBuilder builder(extender);
MetadataParameter parameter;
parameter.parameterName = "Frequency";
parameter.typeName = ot::TypeNames::getFloatTypeName();
parameter.unit = "kHz";


ot::Plot1DCurveCfg curveCfg;
curveCfg.setXAxisTitle("Frequency");
curveCfg.setXAxisUnit("kHz");
curveCfg.setYAxisTitle("Magnitude");
curveCfg.setYAxisUnit("db");

const std::string plotName = "Test/S-Parameter";

std::vector<float> offsets{ 3.5f,7.2f,13.f };
std::shared_ptr<ParameterDescription> parameterDesc = nullptr;
std::list<DatasetDescription> descriptions;
for (int runID = 0; runID < 3; runID++)
{
    DatasetDescription description;

    std::unique_ptr<QuantityDescriptionCurve> quantDesc(new QuantityDescriptionCurve());
    quantDesc->setName("S_11 (Magnitude)");
    quantDesc->addValueDescription("", ot::TypeNames::getFloatTypeName(), "dB");

    for (float i = 0.; i <= 50.; i++)
    {
        float value = i * (runID+1);
        quantDesc->addDatapoint(ot::Variable(value));
        parameter.values.push_back(ot::Variable(i));
    }
    if (parameterDesc == nullptr)
    {
        parameterDesc.reset(new ParameterDescription(parameter, false));
    }

    MetadataParameter additionalParameter;
    additionalParameter.parameterName = "Offset";
    additionalParameter.values.push_back(offsets[runID]);
    additionalParameter.typeName = ot::TypeNames::getFloatTypeName();
    additionalParameter.unit = "mm";
    std::shared_ptr<ParameterDescription> additionalParameterDescription(new ParameterDescription(additionalParameter, true));

    description.setQuantityDescription(quantDesc.release());
    description.addParameterDescription(parameterDesc);
    description.addParameterDescription(additionalParameterDescription);
    descriptions.push_back(std::move(description));
}

int counter = 0;
ot::PainterRainbowIterator rainbowPainterIt;
for (auto& description : descriptions)
{
    curveCfg.setTitle("S_11 (Run ID = " + std::to_string(counter) + ")");
    auto stylePainter = rainbowPainterIt.getNextPainter();
    curveCfg.setLinePen(stylePainter.release());
    counter++;
    builder.addCurve(std::move(description), curveCfg, "Run_ID_" + std::to_string(counter));
}
    ot::Plot1DCfg plotCfg;
    plotCfg.setEntityName(plotName);
    builder.buildPlot(plotCfg);
Executing this will result in: